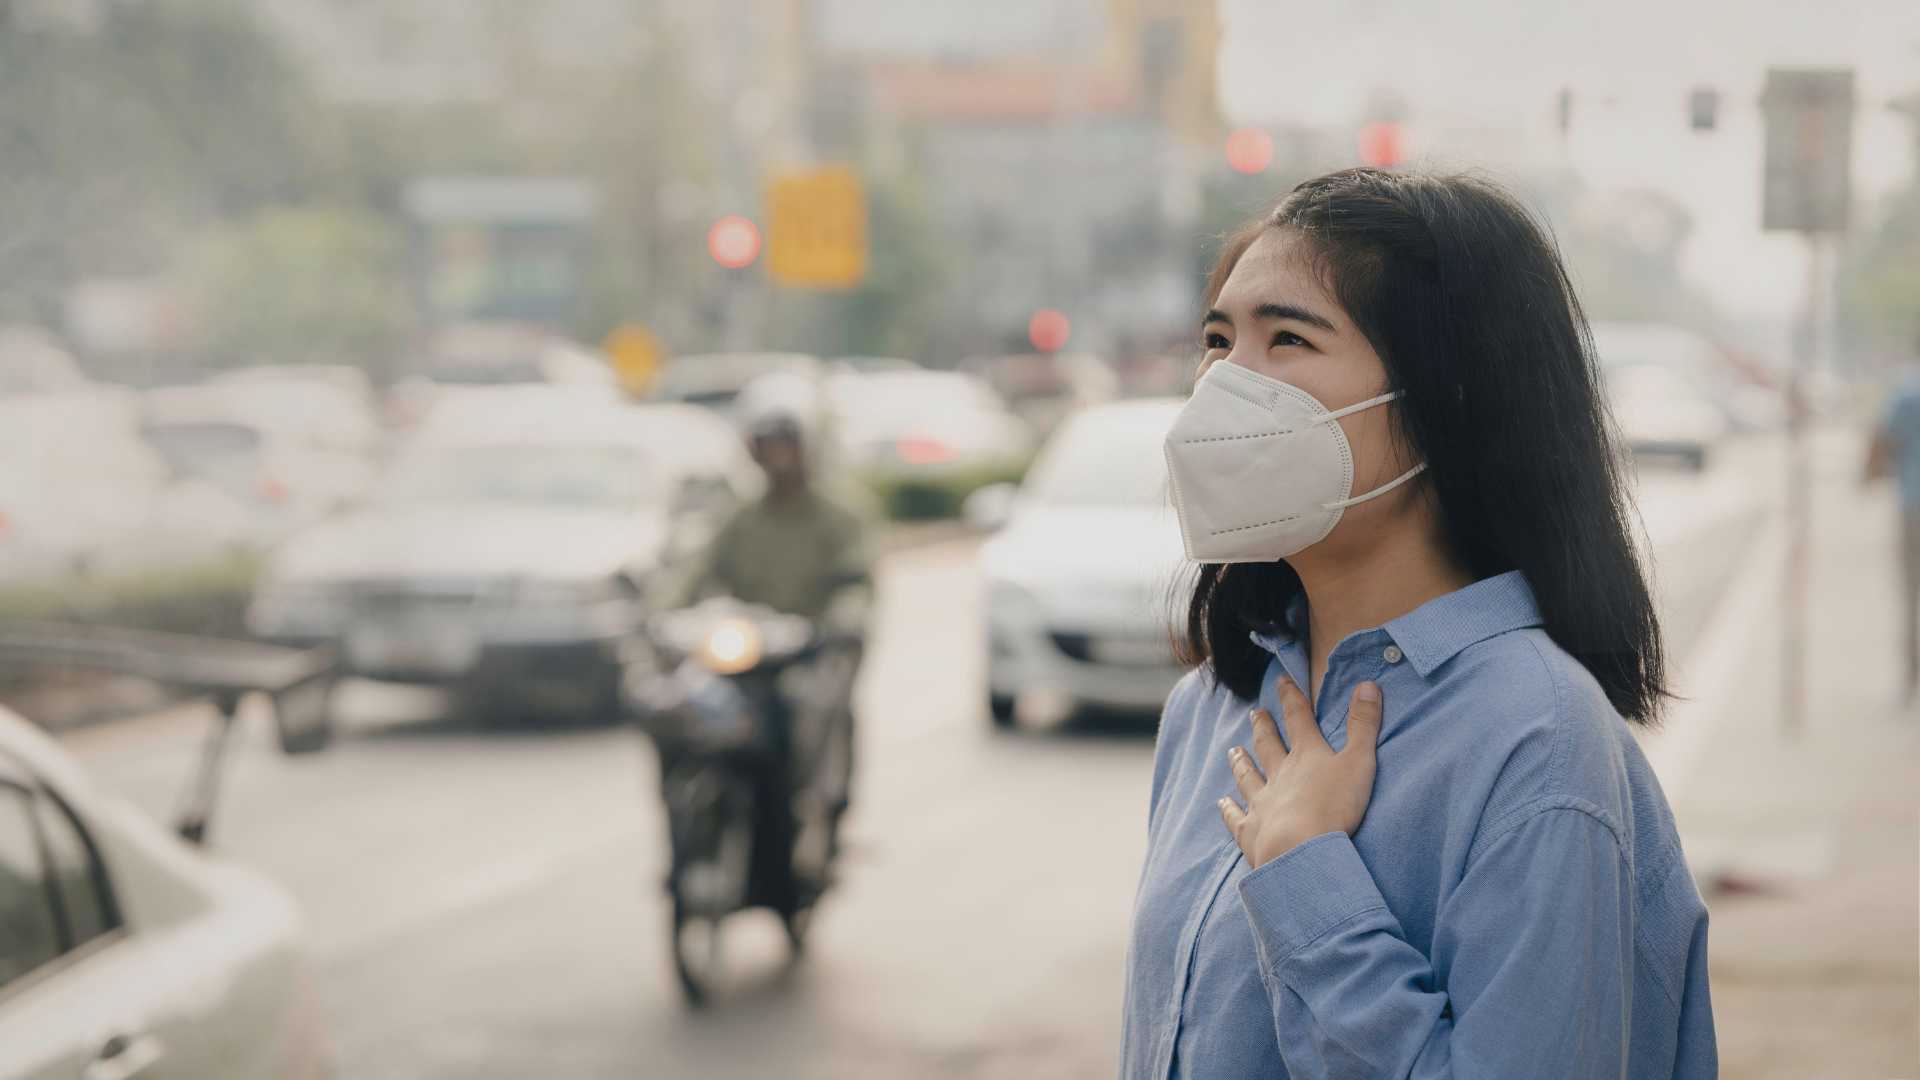
Over 200 Indian Cities Fail to Meet Air Quality Standards
Winter Air Pollution in Indian Cities (2025–26): Key Findings
Air pollution remains a critical public health and environmental challenge in India. Analysis of Central Pollution Control Board (CPCB) data by the Centre for Research on Energy and Clean Air (CREA) highlights the alarming levels of PM2.5 pollution across Indian cities during the winter period (October 1, 2025 – February 28, 2026).
PM2.5 and Its Significance
PM2.5 refers to fine particulate matter with a diameter of 2.5 micrometres or less.
- These particles are extremely small and can penetrate deep into the lungs and bloodstream.
- Exposure is linked to respiratory illnesses, cardiovascular diseases, and premature deaths.
- Because of their small size, PM2.5 particles remain suspended in the air for long periods, especially during winter temperature inversions, worsening urban air quality.
Extent of Pollution Across Indian Cities
The CREA analysis reveals a widespread violation of national air quality standards.
- 204 out of 238 cities recorded PM2.5 levels above the Indian standard.
- The National Ambient Air Quality Standard (NAAQS) for PM2.5 in India is 40 µg/m³ (annual average).
- None of the cities met the World Health Organization (WHO) guideline of 5 µg/m³, indicating that even relatively cleaner cities still exceed global safety benchmarks.
This highlights a large gap between India’s regulatory standard and global health-based guidelines.
Most Polluted Cities During Winter
Northern India dominated the list of most polluted cities.
- Ghaziabad – 172 µg/m³
- Noida – 166 µg/m³
- Delhi – 163 µg/m³
- Greater Noida
- Bahadurgarh
- Dharuhera
- Gurugram
- Bhiwadi
- Charkhi Dadri
- Baghpat
Regional pattern
- Uttar Pradesh – 4 cities
- Haryana – 4 cities
- Delhi – 1 city
- Rajasthan – 1 city
This concentration reflects the severe air pollution crisis across the National Capital Region (NCR), where industrial activity, construction dust, vehicular emissions, crop residue burning, and unfavourable winter meteorology combine to worsen pollution levels.
Air Quality in Major Indian Megacities
Among India’s largest urban centres, several recorded pollution levels well above national standards.
- Delhi – 163 µg/m³
- Kolkata – 78 µg/m³
- Mumbai – 48 µg/m³
- Chennai – 44 µg/m³
- Bengaluru – 39 µg/m³ (slightly below the national limit)
The data shows that even coastal or southern megacities, which usually benefit from better air circulation, are experiencing rising pollution levels, reflecting growing urbanisation and transport emissions.
Cleanest Cities During Winter
Air quality was relatively better in several smaller cities, particularly in southern India.
- Chamarajanagar (Karnataka) – 19 µg/m³ (cleanest city)
Among the ten cleanest cities:
- Eight cities were from Karnataka
- One from Madhya Pradesh
- One from Meghalaya
This suggests that lower industrial intensity, smaller population density, and favourable geography contribute to cleaner air in these regions.
Key Observations
- Winter conditions trap pollutants close to the ground, significantly worsening air quality.
- The NCR region continues to experience the highest pollution levels in India.
- Megacities across the country are increasingly facing pollution pressures, not just northern cities.
- India’s national standards are much less stringent than WHO guidelines, indicating a need for stronger policy alignment with health-based thresholds.
Conclusion
The winter air quality data demonstrates that air pollution is a nationwide problem with strong regional hotspots. Persistent exceedance of national standards and universal violation of WHO guidelines highlight the need for systemic interventions in urban planning, transport policies, industrial regulation, and agricultural practices to address the growing public health risk.
Attribution
Original content sources and authors
Syllabus classification
How this article maps to GS papers
Main syllabus
GS1UrbanisationQuick Q&A
What is PM2.5 pollution, and why is it considered one of the most dangerous forms of air pollution?
The health implications of PM2.5 pollution are severe. Exposure to high concentrations is linked to respiratory diseases such as asthma, bronchitis, and chronic obstructive pulmonary disease (COPD). It also increases the risk of cardiovascular diseases, stroke, lung cancer, and premature mortality. According to global health research, long-term exposure to PM2.5 significantly reduces life expectancy in heavily polluted regions. In urban areas of India, where industrialisation and vehicular density are high, PM2.5 pollution has become a major public health crisis.
Environmental monitoring agencies such as the Central Pollution Control Board (CPCB) measure PM2.5 levels through Continuous Ambient Air Quality Monitoring Stations (CAAQMS). India's National Ambient Air Quality Standards (NAAQS) set the annual PM2.5 limit at 40 µg/m³, while the World Health Organization (WHO) recommends a much stricter guideline of 5 µg/m³. The significant gap between these limits highlights the seriousness of the air pollution challenge faced by many Indian cities.
Why does air pollution in India tend to worsen during the winter months, particularly in northern cities like Delhi and Ghaziabad?
Another important contributor is the seasonal practice of crop residue burning in states such as Punjab and Haryana. Farmers burn leftover stubble after harvesting paddy to quickly prepare fields for the next crop cycle. Smoke from these fires travels across northern India and combines with local emissions from vehicles, industries, and construction activities, significantly worsening air quality in cities such as Delhi and the surrounding National Capital Region (NCR).
Additionally, winter months see increased use of solid fuels and biomass for heating in many regions. Festive activities such as firecrackers during Diwali can also temporarily elevate pollution levels. Combined with calm wind conditions and reduced atmospheric mixing, these factors create a situation where pollutants remain trapped over urban areas for prolonged periods. This explains why winter air quality in many Indian cities frequently exceeds both national and international safety standards.
How do monitoring systems like the Continuous Ambient Air Quality Monitoring Stations (CAAQMS) help policymakers address air pollution in India?
One key benefit of CAAQMS is the ability to generate real-time air quality indices (AQI), which help authorities issue public health advisories during severe pollution episodes. For example, when pollution levels reach hazardous categories, governments may implement emergency measures such as restricting construction activities, limiting vehicular movement, or temporarily shutting down polluting industries. Data-driven decisions are essential for managing acute pollution episodes, particularly during winter in northern India.
Furthermore, long-term monitoring data helps policymakers identify pollution trends, major emission sources, and regional pollution patterns. This information is critical for designing policies such as the National Clean Air Programme (NCAP), which aims to reduce particulate pollution in major Indian cities. By providing reliable scientific evidence, monitoring systems ensure that air pollution policies are grounded in accurate data and targeted interventions.
What factors explain why many of the most polluted cities in India are located in the National Capital Region (NCR)?
Geography also plays a role in the region’s pollution problem. The Indo-Gangetic Plain, where NCR is located, has relatively weak wind circulation during winter. This reduces the dispersal of pollutants and causes them to accumulate in the atmosphere. Additionally, pollution generated in neighbouring states—particularly from agricultural residue burning—can travel long distances and intensify the pollution load in the NCR.
Another contributing factor is the concentration of economic activity in the region. NCR functions as a major industrial, commercial, and transportation hub. Freight movement, thermal power plants, brick kilns, and diesel generator usage add to the pollution burden. The combination of these structural factors makes NCR one of the most challenging regions in the world for air quality management.
Critically analyse the effectiveness of India’s policies such as the National Clean Air Programme (NCAP) in addressing urban air pollution.
The programme has achieved certain positive outcomes. Air quality monitoring infrastructure has expanded significantly, and many cities now have comprehensive pollution control strategies. Initiatives such as the adoption of Bharat Stage VI vehicle emission standards, promotion of electric mobility, and the expansion of LPG connections under schemes like Ujjwala have contributed to reducing emissions in some sectors.
However, challenges remain. Critics argue that NCAP lacks legally binding enforcement mechanisms and relies heavily on coordination between multiple agencies, which can slow implementation. Urban governance issues, funding constraints, and weak enforcement of pollution control regulations further limit its effectiveness. Therefore, while NCAP represents a significant step toward addressing air pollution, stronger regulatory enforcement, regional coordination, and sustainable urban planning are needed to achieve long-term improvements in air quality.
Provide examples of cities or regions that have successfully improved air quality and discuss the lessons they offer for India.
Within India, some smaller cities have also demonstrated relatively better air quality management. For instance, cities in Karnataka such as Chamarajanagar have maintained lower pollution levels due to lower industrial density, better urban planning, and favourable geographical conditions. While these cities may not face the same scale of pollution as large metropolitan areas, they highlight the importance of sustainable development practices.
The key lessons from these examples include the importance of strong regulatory enforcement, technological innovation, and public participation. Investments in clean public transport, stricter emission standards, and urban planning that prioritises green spaces can significantly improve air quality. India can adapt these strategies while considering its own socio-economic and institutional context.
Suppose you are an urban policymaker tasked with reducing PM2.5 levels in a highly polluted city. What policy measures would you prioritise to improve air quality?
The second set of measures would focus on controlling industrial and construction-related emissions. Authorities can enforce stricter pollution standards for factories, require dust suppression technologies at construction sites, and regulate brick kilns and diesel generators. Urban greening initiatives such as expanding parks and planting trees can also help absorb pollutants and improve local air quality.
Finally, public participation and behavioural change are essential components of effective air pollution management. Awareness campaigns encouraging carpooling, waste management reforms to prevent open burning, and incentives for adopting clean energy technologies can significantly reduce pollution levels. By combining regulatory measures, infrastructure development, and community engagement, cities can create a comprehensive strategy to tackle PM2.5 pollution and protect public health.
Practice questions
1 question for mains preparation