"As climate change stretches the pollen season and urban municipalities plant more trees for shade, understanding where pollen goes has become a public health concern."
| Indicator | Data |
|---|---|
| Study published in | Physics of Fluids |
| Research teams | France + USA |
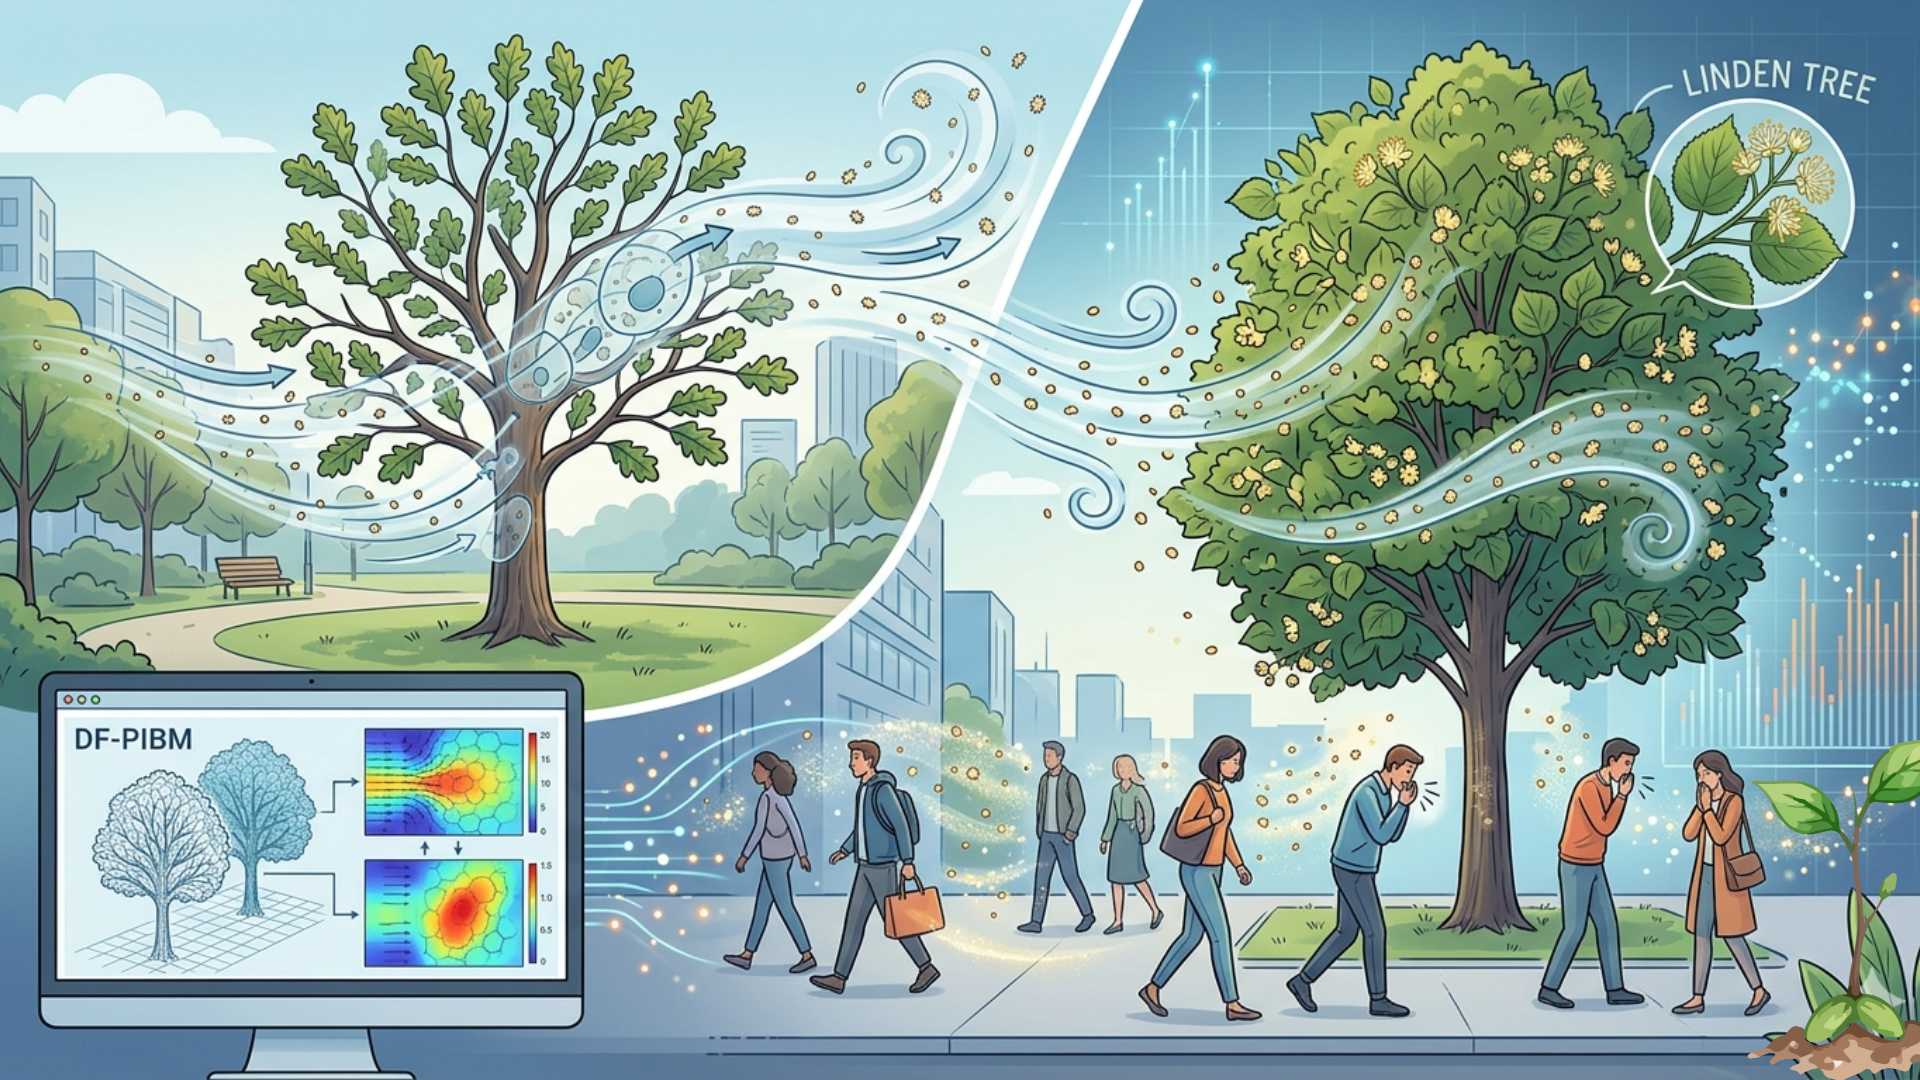
| Model name | DF-PIBM (Direct-Forcing Porous Immersed Boundary Method) |
| Pollen detachment force | ~50 billionths of a newton (≈ weight of single human cell) |
| Model accuracy vs. LiDAR measurements | Within 5% |
| Simulated pollen grains (linden experiment) | ~1 lakh grains over 4 minutes |
| Wind speed simulated | 5 km/hr |
Background & Context
Airborne pollen is a leading cause of allergic rhinitis (hay fever) and asthma globally — affecting an estimated 400 million people worldwide. Climate change is extending pollen seasons and increasing pollen concentrations. Urban tree-planting drives for shade and carbon sequestration are inadvertently intensifying allergen exposure. Until now, scientists lacked precise simulation tools at the single-tree + real urban environment scale.
What is DF-PIBM?
Direct-Forcing Porous Immersed Boundary Method treats a tree as a porous medium (like a sponge) — air flows through leaves and branches rather than around a solid object. The simulation:
- Divides the tree into cells → calculates wind speed + pressure in each
- When pressure exceeds detachment force (~50 billionths of a newton) → pollen grain released
- Tracks each grain's trajectory using laws of fluid physics
- Accounts for leaf density variation across different tree parts
Key Findings
Leaf density = critical variable:
| Tree Type | Leaf Density | Pollen Dispersal Pattern |
|---|---|---|
| Oak | Sparse, spread-out | Even cloud, slow spread |
| Linden | Dense | Turbulent, uneven bursts |
- Pollen concentrates in the tree's wake (directly downwind) — precisely where pedestrians walk
- Tens of thousands of grains become airborne within seconds of wind contact
- Linden tree pollen specifically triggers hay fever + coughing
Validation: Model tested against air flow past cylinders and spheres → then compared against LiDAR measurements around a Danish oak tree → 5% accuracy margin achieved.
UPSC Relevance — Connecting the Dots
Public Health: Pollen mapping = direct input for urban allergy management; WHO recognises allergic rhinitis as a significant non-communicable disease burden.
Climate Change Link: Longer, more intense pollen seasons = direct climate change health impact; connects to India's commitments under Paris Agreement + National Action Plan on Climate Change (NAPCC).
Urban Planning: Tool can guide which trees to plant where — critical for Smart Cities Mission, urban forestry drives, and green infrastructure planning under AMRUT 2.0.
Science & Technology: DF-PIBM demonstrates computational fluid dynamics applied to public health — example of interdisciplinary science (physics + biology + urban planning).
Limitations & Future Scope
Current limitations:
- Does not model pollen grain collisions or surface adhesion
- Single-tree scale — not yet neighbourhood or city scale
Future applications:
- Scale up to simulate entire neighbourhoods
- City planners can use outputs to decide species selection + placement
- Integration with air quality monitoring systems + health alert platforms
India Relevance
India's urban tree-planting drives under the National Urban Forest Programme and Smart Cities Mission lack allergen-sensitivity frameworks. Cities like Delhi, Bengaluru, and Pune already face significant seasonal pollen loads. Tools like DF-PIBM could inform India's urban biodiversity policy — choosing low-allergen species in high-pedestrian zones, especially near hospitals, schools, and public spaces.
Conclusion
The DF-PIBM model represents a meaningful convergence of computational physics and public health policy. Its significance lies not in the science alone but in its governance application — equipping urban planners with precision tools to balance green cover goals against allergen exposure risks. As Indian cities accelerate tree-planting under climate commitments, integrating allergen-aware species selection into urban forestry policy is a low-cost, high-impact public health intervention whose time has come.