1. Context of the Har Ghar Jal (HGJ) Scheme
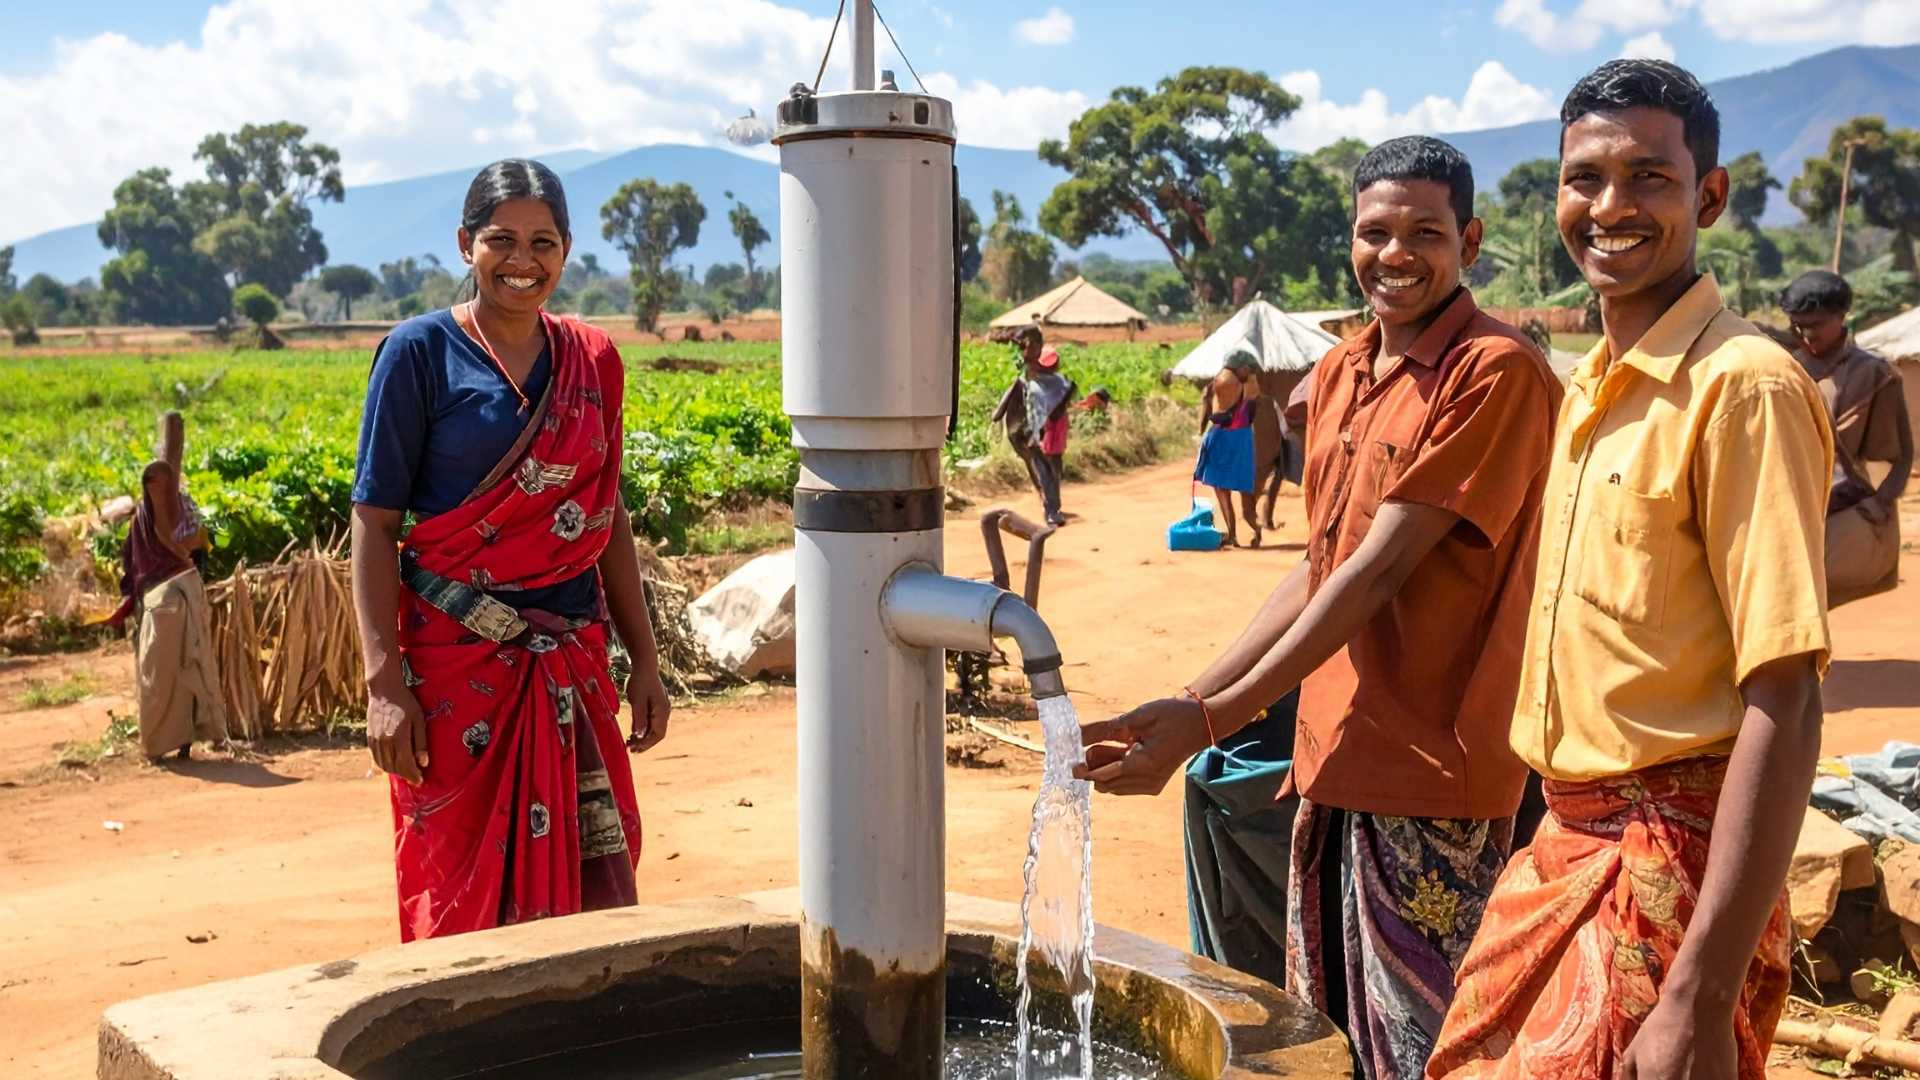
Rural drinking water access has expanded significantly under the Jal Jeevan Mission (JJM), with 98% of surveyed rural households now equipped with tap connections. However, access is not translating into full functionality: actual usage, reliability, and water quality lag behind infrastructure coverage. This gap marks a key governance challenge in last-mile service delivery.
The 2024 Functionality Assessment, commissioned by the Ministry of Jal Shakti and conducted by IPSOS, reviewed 2.37 lakh households across villages certified as HGJ. Certified villages are those officially declared fully covered by the State administration. By focusing solely on certified villages, the survey reveals internal inconsistencies between reporting and ground reality.
The scheme aims to supply 55 litres of potable water per person per day, but the survey shows that regularity, flow, and quality remain uneven. States such as Bihar, Uttar Pradesh, Nagaland, Sikkim, and even some high-performing states like Gujarat show significant gaps between coverage and functional delivery.
Functionality assessments show that infrastructure provisioning alone cannot ensure service delivery; if reliability and quality gaps persist, the scheme risks slipping into a coverage-only metric rather than advancing rural health, dignity, and economic productivity.
2. Availability vs. Actual Supply
Nearly all households surveyed reported having a tap, indicating success in infrastructure rollout. Yet only 83% received water at least once in the preceding week, exposing gaps in regularity and supply-side constraints. Some States—including Goa, Gujarat, Andhra Pradesh, and several UTs—reported high reliability, whereas Bihar (61%), UP (72%), and Nagaland (74%) fared poorly.
Water quantity was also suboptimal: only 80% of households received the mandated 55 litres per capita per day. States like Sikkim (24%) and Gujarat (58%) lagged significantly behind, reflecting either supply limitations or distribution inefficiencies.
Key Statistics:
- 98%: Households with a tap connection
- 83%: Households receiving water at least once in 7 days
- 80%: Receiving mandated 55 LPCD
- Sikkim 24%, Gujarat 58%: Lowest fulfilment of LPCD norms
When tap presence is not matched by predictable supply, household trust in public infrastructure declines and communities revert to unsafe water sources, undermining the mission’s health and development gains.
3. Water Quality and Cleanliness
The assessment found that only 76% of households met quality norms based on parameters such as E. coli, total coliform, and pH levels. This highlights unresolved challenges in treatment, source protection, and local-level O&M.
While most states reported over 85% satisfaction with water quality, Tripura was an exception with only 43% satisfaction. The divergence between household perception and lab evidence indicates that users may tolerate substandard water due to low awareness or the absence of alternatives.
Impact Highlights:
- Only 76% of households meet water-quality norms.
- High satisfaction in user surveys does not always correlate with scientific testing.
"The water crisis is a governance crisis." — UNDP Human Development Report (2006)
If water quality remains inconsistent, it will dilute the mission’s health outcomes and escalate rural disease burdens, neutralising gains in WASH and SDG-6 compliance.
4. Certified Villages: Reporting vs. Reality
The 2024 assessment only covered 19,812 villages that States had certified as fully covered (HGJ villages). However, functionality gaps within these villages suggest issues in certification methodology, monitoring, and ground-verification. Nationally, only 2.72 lakh of India’s 5.8 lakh villages are HGJ-certified, indicating uneven progress and wide inter-state variation.
The Ministry itself clarified that the 2024 report is not comparable to the 2022 assessment due to differences in sampling, geography, and timing. In 2022, the corresponding metrics were higher on several fronts: 91% working taps, 88% receiving prescribed supply, and 69% fully functional connections. Divergence may reflect either improved measurement or stagnation in ground performance.
Comparative Notes (2022 vs 2024):
- 91% → 83%: Regularity of supply dropped in reported metrics
- 88% → 80%: Mandated supply fulfilment lower
- 69% → 76%: Overall functionality higher (different methodology)
Certification-based sampling reveals systemic mismatches between administrative reporting and household-level experience; without independent verification, official coverage claims may outpace actual service delivery.
5. Financial Progress and Extended Timelines
Budget documents show a slowdown in fund utilisation: against a provision of ₹70,000 crore (2024–25), only ₹22,694 crore was expected to be spent by March 2025. Weak spending indicates delays in project execution, contracting, or state-level capacity.
The mission, originally slated for 100% functionality by 2024, has now been extended to 2028. With national coverage at about 81%, the remaining 20% needs nearly ₹4 lakh crore, almost equal to the ₹3.6 lakh crore spent since 2019. High financial requirements for the “last mile” reflect the challenges of reaching water-scarce regions, complex terrains, and dispersed communities.
Financial Takeaways:
- ₹70,000 crore allocated; ₹22,694 crore likely spent
- Remaining coverage needs ₹4 lakh crore
- Delay in achieving original 2024 target → extended to 2028
"Budgeting is not just numbers; it is the art of translating plans into outcomes." — Public Financial Management literature
Insufficient expenditure and extended timelines risk lowering stakeholder confidence and delaying rural development multipliers such as health, education, and women’s empowerment.
6. Key Challenges Identified
- Supply gaps: Inadequate source availability, seasonal fluctuations.
- Quality inconsistencies: Limited testing capacity, weak treatment systems.
- O&M issues: Irregular electricity, pump breakdowns, leakage.
- Institutional gaps: Over-reliance on administrative certification.
- Financial underutilisation: Slow project execution at state level.
These challenges illustrate the importance of strengthening supply chains, institutional mechanisms, and household-level monitoring to convert infrastructure into lasting outcomes.
7. Governance and Policy Way Forward
- Improve independent third-party verification of HGJ certification.
- Enhance water-quality testing infrastructure at village and block levels.
- Strengthen O&M through community-based management and Panchayat-led systems.
- Accelerate financial utilisation and streamline state-level clearance processes.
- Prioritise water-stressed and low-performing states through special assistance.
An outcomes-oriented approach, beyond mere coverage reporting, will help align the scheme with SDG-6 and holistic rural development.
Conclusion
The 2024 Functionality Assessment shows that India’s rural water mission has achieved near-universal tap installation but continues to face substantial challenges in reliability, adequacy, and quality. To protect health and ensure sustainable access, governance must shift from infrastructure expansion to long-term service delivery. Strengthened monitoring, improved water quality systems, and robust financing will be key to achieving universal, functional, and safe rural water supply by 2028.