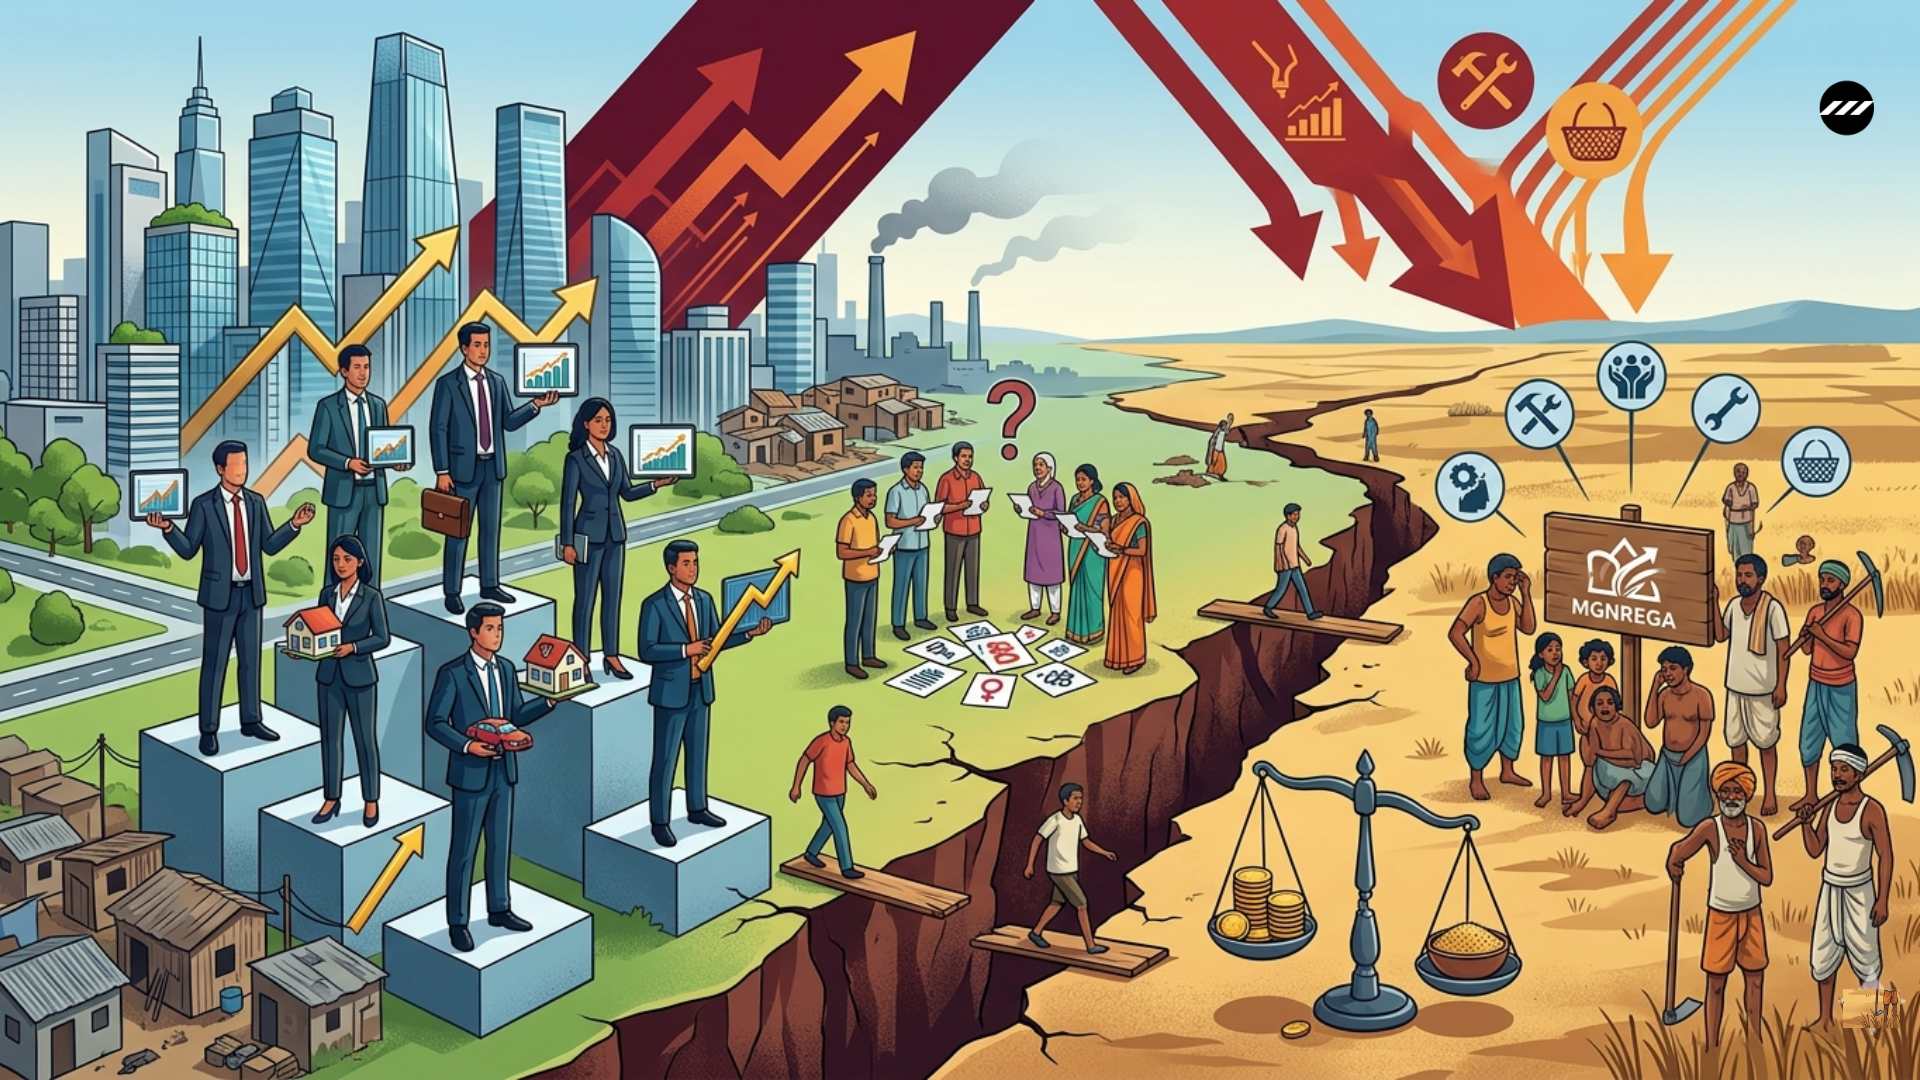
Understanding Inequality in India’s Growth Story

Introduction
-
India's consumption inequality (Gini: 0.29, HCES 2023-24) exceeds the World Bank's cited figure of 0.25 — and even this is a gross underestimate, as NSS surveys systematically miss the superrich.
-
Recent legislative shifts — the new Labour Codes and replacement of MGNREGA with the Viksit Bharat-Guarantee for Rozgar and Ajeevika Mission (Gramin) Bill, 2025 — have sharpened concerns over informal worker welfare amid official claims of declining disparity.
"Policies formulated on the presupposition of lower disparity could be misleading and may produce adverse, albeit unintended, welfare implications." — HCES 2023-24 analysis
| Indicator | Rural | Urban |
|---|---|---|
| Gini Index | Lower | Higher |
| Avg non-food MPCE vs all-India avg | Below 1 (below average) | ~1.5x (above average) |
| Mean MPCE: Top vs Bottom decile | 4.5x | 6x |
| Urban top decile vs Rural bottom decile MPCE | — | 9x |
| Top 10% share of non-food expenditure | — | 27% |
| Top 5% vs Bottom 5% MPCE gap | 6x | 9x |
Key Conceptual Framework
Before analysing inequality, four clarifications are essential — and frequently tested in UPSC answers:
- Inequality of what? — Income, wealth, or consumption expenditure yield different estimates. India's surveys primarily capture consumption, likely understating true disparity.
- How measured? — Gini index is standard but sensitive to methodology; World Bank's method itself came under scrutiny here.
- Along which axis? — Caste, class, gender, religion each reveal different fault lines. Inter-personal decile analysis alone is insufficient.
- Data comparability — Methodological changes across survey rounds make trend comparison unreliable.
Patterns of Inequality: What the Data Shows
Urban-Rural Gap
Growth-inducing activities remain urban-centric while agricultural distress persists. The mean ratio (ratio of sector average to all-India average) captures this starkly — urban non-food MPCE is ~1.5x the national average, while rural non-food MPCE falls well below it. The disparity is sharper for non-food expenditure than food, reflecting that India's consumption boom has been driven predominantly by non-food spending.
Within Urban India
Urban inequality is more acute than rural. The top 10% alone account for 27% of total urban non-food expenditure, leaving 90% of the population sharing the remaining 73%. Between-decile inequality accounts for 90% of non-food expenditure inequality and 67% of food expenditure inequality — meaning the gap between groups drives overall inequality far more than variation within groups.
Within Rural India
Rural inequality, while lower, remains significant. The richest 5% spend 6x more than the poorest 5%. Between-decile inequality similarly dominates, particularly for non-food expenditure.
Class-Based Analysis: Beyond Deciles
Standard decile analysis misses the structural drivers of inequality. Vakulabharanam (Class and Inequality in China and India, 1950–2010, UMass Amherst) shows:
- Since the 1980s — even before the 1991 reforms — urban owners, managers, and professionals gained disproportionately
- Urban informal workers, rural small farmers, and agricultural labourers have consistently lagged
- Between-class inequality has risen sharply relative to within-class inequality
- No systemic policy reversal has occurred in the last decade despite various welfare schemes
- A large share of Indians sustains consumption through debt — masking real income fragility at the bottom
This growth-class-inequality nexus is routinely overlooked in conventional analysis.
Data Limitations: The Underestimation Problem
NSS surveys — whether consumption or wealth-based — fail to capture the superrich. Evidence of this distortion:
- ~25% of even the richest 10% reportedly benefited from PMGKY (a poverty-targeted scheme)
- ~13% of the richest decile hold BPL ration cards
This points to severe mis-targeting of welfare schemes and confirms that any inequality estimate from NSS data is a floor, not a ceiling.
Policy Implications & Challenges
- Labour Codes: Consolidation of 29 labour laws into 4 codes raises concerns about weakening protections for informal workers — India's largest labour segment
- MGNREGA replacement: Shifting from a demand-driven employment guarantee to a mission-based model risks undermining the rural safety net without proven alternatives
- Welfare mis-targeting: If baseline data understates inequality, schemes designed for the poor may disproportionately benefit those above the poverty line
- Narrative risk: Official framing of "declining inequality" — unsupported by comparable data — may justify premature withdrawal of redistributive policy
Conclusion
"India's inequality challenge is structural, not statistical. It is rooted in class asymmetries, urban-rural divides, and a consumption boom that has bypassed the bottom."
Data limitations make it easy to understate the problem; methodological changes across surveys make it easy to claim improvement. Sound policymaking requires moving beyond the Gini index to a broader framework of distributive justice — one that accounts for class, caste, gender, and the structural exclusion of informal workers from the gains of growth.
Attribution
Original content sources and authors

Syllabus classification
How this article maps to GS papers
Main syllabus
GS3Jobs & Inclusive GrowthQuick Q&A
What are the different dimensions of inequality discussed in the article, and why is inequality measurement in India complex?
The article highlights that urban India is considerably more unequal than rural India. The top 10% in urban areas account for 27% of total non-food expenditure, while the bottom sections remain marginalized. Similarly, the mean monthly per capita expenditure (MPCE) of the richest urban decile is many times higher than that of the poorest rural decile. These findings reveal that inequality is not only interpersonal but also structural and spatial.
The complexity of inequality measurement arises due to methodological and institutional limitations. Different surveys use varying methodologies, making comparability difficult. The article notes that even World Bank estimates have been criticized. Moreover, official surveys such as NSSO often fail to adequately capture the “super-rich,” leading to underestimation of inequality levels. The paradoxical finding that some members of the richest deciles possess Below Poverty Line cards or benefit from welfare schemes demonstrates flaws in identification and data quality.
Another challenge is that inequality cannot be fully understood without analyzing class structures and growth patterns. As scholars like Vamsi Vakulabharanam argue, economic liberalization and urban-centric growth disproportionately benefited owners, managers, and professionals while informal workers, agricultural labourers, and small farmers lagged behind. Therefore, inequality in India is deeply embedded in the country’s development trajectory and social hierarchy.
Why is urban India considered more unequal than rural India despite higher levels of affluence and economic growth?
The article provides significant evidence of this disparity. The top urban decile accounts for a disproportionately large share of non-food expenditure, and the mean monthly per capita expenditure of the richest urban groups is several times greater than that of the poorest sections. Urban growth has primarily driven non-food consumption such as education, healthcare, housing, transport, and luxury goods, which remain inaccessible to lower-income groups. Consequently, consumption inequality becomes sharper in cities.
Another major reason is the nature of India’s growth process. Economic reforms and globalization since the 1980s disproportionately benefited capital-intensive and skill-intensive sectors concentrated in urban areas. High-income professionals gained access to global markets, digital economies, and financial assets, whereas informal workers experienced stagnant wages, job insecurity, and rising living costs. The expansion of the gig economy and contractual labour has further deepened this divide.
Urban inequality also reflects unequal access to public services. Metropolitan cities often display sharp contrasts between affluent gated communities and sprawling informal settlements lacking sanitation, healthcare, and quality education. Rising housing costs and privatization of essential services intensify exclusion for the urban poor. Therefore, urban affluence does not necessarily imply inclusive development. Instead, Indian cities increasingly demonstrate a dual economy where prosperity and deprivation coexist side by side. This trend poses serious challenges for social cohesion, democratic stability, and sustainable urbanization.
How do labour policy changes and rural employment reforms influence inequality dynamics in India?
The new Labour Codes aim to simplify labour regulations and improve ease of doing business. However, critics argue that greater flexibility for employers may weaken worker protections, reduce job security, and dilute collective bargaining rights. Since a majority of India’s workforce is employed in the informal sector, any reduction in labour safeguards could disproportionately hurt low-income workers. This may widen income disparities between organized-sector professionals and informal labourers.
Similarly, reforms affecting rural employment programs have important implications for rural inequality. MGNREGA functioned not only as a wage-employment scheme but also as a social protection mechanism during economic distress. It increased rural purchasing power, reduced seasonal migration, and strengthened the bargaining position of agricultural labourers. Replacing or restructuring such programs without ensuring equivalent protections could weaken rural livelihoods, especially during periods of agrarian distress and unemployment.
The article also points to the broader issue of debt-led consumption among large sections of the population. If welfare support weakens while economic inequality persists, poorer households may increasingly rely on borrowing to sustain consumption. This creates long-term financial vulnerability. Therefore, labour and welfare reforms must be assessed not only through the lens of economic efficiency but also in terms of distributive justice, social stability, and inclusive growth. Policies based on the assumption that inequality is declining may produce unintended adverse consequences for marginalized communities.
Critically analyze the relationship between economic growth, class structure, and inequality in post-liberalization India.
The article references Vamsi Vakulabharanam’s analysis, which argues that urban owners, managers, and professionals gained disproportionately from economic transformation, while agricultural labourers, small farmers, and informal workers lagged behind. This led to rising “between-class inequality,” where disparities between socio-economic groups became more significant than inequalities within groups themselves. Urban-centric growth models reinforced this trend by concentrating investments, infrastructure, and high-paying jobs in metropolitan regions.
Critically, the growth process did reduce poverty to some extent, but it did not ensure equitable distribution. Welfare schemes such as food subsidies, PMGKY, and rural employment programs provided temporary relief but did not fundamentally alter structural inequalities related to asset ownership, education, employment quality, and access to capital. As a result, consumption growth among poorer sections often remained debt-driven rather than income-driven.
Another concern is that official inequality estimates may underestimate the true scale of concentration of wealth because surveys fail to adequately capture the super-rich. Thus, policy narratives claiming declining inequality may overlook hidden forms of concentration and exclusion. Nevertheless, proponents of liberalization argue that economic growth generates employment opportunities, expands markets, and increases fiscal capacity for welfare spending.
The critical challenge for India is therefore not growth versus redistribution, but designing a development model that balances efficiency with social justice. Inclusive growth requires stronger labour protections, investment in public services, equitable taxation, and policies that enhance productive capabilities among marginalized groups rather than relying solely on market-led expansion.
How does consumption expenditure data reveal hidden forms of inequality in India? Illustrate with examples from the article.
One striking example highlighted in the article is the difference between food and non-food expenditure inequality. Non-food expenditure, which includes healthcare, education, transport, housing, and consumer goods, is far more unequal than food expenditure. This indicates that while basic food consumption may be relatively widespread, access to higher-quality services and improved standards of living remains highly unequal.
The urban-rural divide further illustrates hidden inequalities. Average urban non-food monthly per capita expenditure is about 1.5 times the national average, whereas rural expenditure remains far below it. Additionally, the top 10% in urban India account for 27% of total non-food expenditure. The richest urban decile spends several times more than the poorest rural decile, highlighting the concentration of purchasing power among affluent urban classes.
The article also reveals the unequal distribution of welfare access. Surprisingly, some members of the richest sections reportedly benefited from welfare schemes such as PMGKY and possessed Below Poverty Line ration cards. This exposes administrative leakages and exclusion errors in targeting mechanisms.
Consumption data therefore captures disparities in opportunity, access, and quality of life. It reflects not only economic status but also access to healthcare, education, mobility, and social mobility. Policymakers can use such data to design more targeted welfare interventions, identify vulnerable groups, and understand how growth patterns influence everyday living conditions across different socio-economic categories.
What lessons can policymakers draw from India’s inequality trends while designing future welfare and development policies?
The article demonstrates that inequality is especially severe in non-food expenditure categories such as healthcare, education, and housing. This implies that public provisioning of essential services remains inadequate. Policymakers must therefore strengthen investments in universal healthcare, quality public education, affordable housing, and social security systems. Such investments reduce dependence on debt-led private consumption and improve long-term human development outcomes.
Another important lesson is the need for better labour and employment policies. Informal workers, small farmers, and agricultural labourers continue to remain vulnerable despite welfare schemes. Labour reforms and rural employment policies must therefore prioritize income security, decent work conditions, and collective bargaining protections. Welfare schemes should complement rather than substitute structural employment generation.
The article also highlights the importance of accurate data collection. Underestimation of inequality due to methodological limitations can create misleading policy assumptions. If governments assume inequality is declining when it is actually widening, welfare reductions or labour deregulation could worsen socio-economic distress. Therefore, transparent and robust statistical systems are essential for evidence-based policymaking.
Finally, policymakers must recognize that inequality is not merely an economic issue but also a political and social challenge. Excessive disparities can weaken social cohesion, fuel discontent, and undermine democratic legitimacy. Sustainable development in India requires balancing market-led growth with redistributive measures, regional development strategies, and institutional reforms that expand opportunities for historically marginalized communities.
Practice questions
2 questions for mains preparation